curve()#
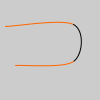
Draws a curved line on the screen.
Examples#

def setup():
    py5.no_fill()
    py5.stroke(255, 102, 0)
    py5.curve(5, 26, 5, 26, 73, 24, 73, 61)
    py5.stroke(0)
    py5.curve(5, 26, 73, 24, 73, 61, 15, 65)
    py5.stroke(255, 102, 0)
    py5.curve(73, 24, 73, 61, 15, 65, 15, 65)
Description#
Draws a curved line on the screen. The first and second parameters specify the beginning control point and the last two parameters specify the ending control point. The middle parameters specify the start and stop of the curve. Longer curves can be created by putting a series of curve() functions together or using curve_vertex(). An additional function called curve_tightness() provides control for the visual quality of the curve. The curve() function is an implementation of Catmull-Rom splines. Using the 3D version requires rendering with P3D.
Underlying Processing method: curve
Signatures#
curve(
    x1: float,  # coordinates for the beginning control point
    y1: float,  # coordinates for the beginning control point
    x2: float,  # coordinates for the first point
    y2: float,  # coordinates for the first point
    x3: float,  # coordinates for the second point
    y3: float,  # coordinates for the second point
    x4: float,  # coordinates for the ending control point
    y4: float,  # coordinates for the ending control point
    /,
) -> None

curve(
    x1: float,  # coordinates for the beginning control point
    y1: float,  # coordinates for the beginning control point
    z1: float,  # coordinates for the beginning control point
    x2: float,  # coordinates for the first point
    y2: float,  # coordinates for the first point
    z2: float,  # coordinates for the first point
    x3: float,  # coordinates for the second point
    y3: float,  # coordinates for the second point
    z3: float,  # coordinates for the second point
    x4: float,  # coordinates for the ending control point
    y4: float,  # coordinates for the ending control point
    z4: float,  # coordinates for the ending control point
    /,
) -> None
Updated on March 06, 2023 02:49:26am UTC
